Functionality
Affectli is a trusted multi-tenancy solution for ANY organisation looking to improve risk management, increase innovation and make meaningful data-driven decisions.
Communication


Chat & Broadcast Messaging
Affectli allows you to send a broadcast message to as many members of your organisation as you need and send them all the same message or notification simultaneously.
Instant Messaging
Affectli has a built-in instant messaging system for one-on-one conversations and group discussions.
Contextual Collaboration
Affectli allows for Contextual Communications to ensure the right message is delivered to the right audience at the right time, using the right channel.
Scheduled
Affectli allows you to schedule your messages to send at a specific time and date.
AI & M2M
Data in Motion AI
Data that is actively being transferred between locations for example private networks, public internet channels, cloud or SaaS providers, wireless transmissions, and physical methods like portable drives.
Data at Rest AI
Data that has reached its destination and is not currently being accessed for example computer memory ready and waiting to be updated or read.
AI Engine Agnostic
A device or software program can be described as agnostic if its function is irrelevant to the method or format used to transmit the data. By receiving data from multiple sources or in multiple formats, the device or program can still process the data effectively.
AI Model Agnostic
By using model-agnostic approaches to study underlying structures, one can avoid bias in interpretation and the assumption that they can be accurately described by the model due to their nature.


Maps

Situational Awareness
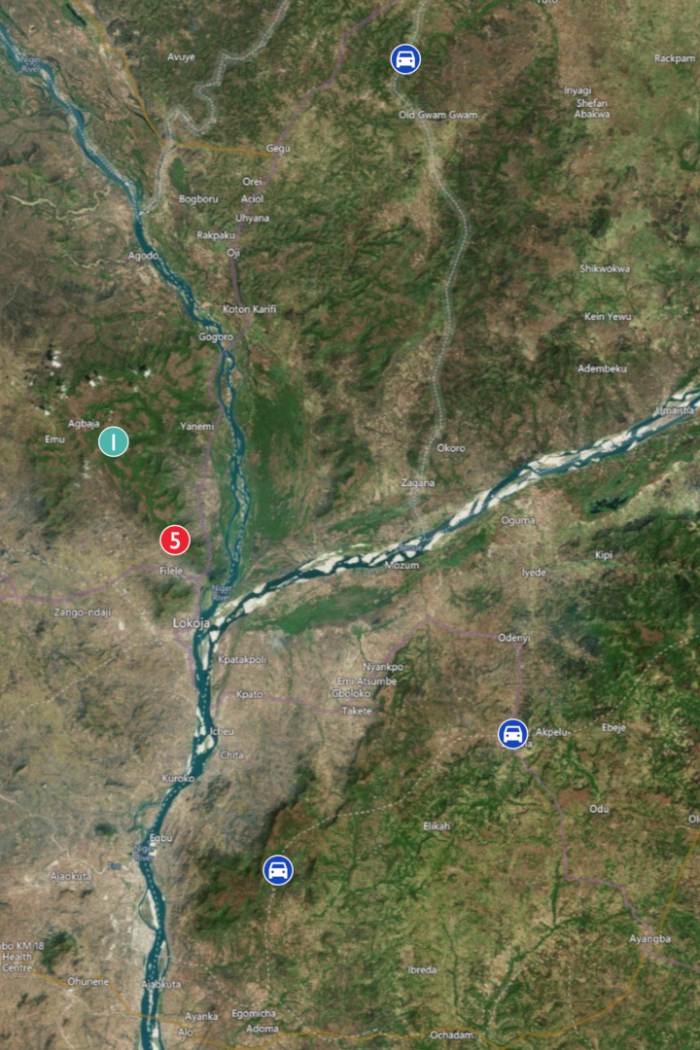
Situational awareness is an important decision making factor. Using our maps you can quickly check on any data point to check its status, errors that may be shown and more.
Pivot on Data
Using the map you can choose any data point to focus on and get more information about it for example a transport vehicle, an office, a branch, a warehouse or even livestock
Heat Maps
Our heat maps allow you to quickly visualise your organisations temperature using colour variations from your data retrieving devices.
Custom Map Layers
Decide exactly what you want to see on your maps using our custom lap layers without any additional non essential data points.
Big Data
Data Ingestion
Using data ingestion, it is possible to store large, assorted data files in one, cloud-based storage area, such as a data warehouse, data mart, or database to be analysed and accessed.
Data Lake
An analysis and query of a large database, or multiple databases, is what a data pool is. A data lake, or big data storage, is a storage space for big data, which allows advanced correlation and analytics to solve modern problems. Data lakes are virtual repositories for relational and non-relational databases.


Orchestration


Intelligent Workflow
To perform diverse and complex activities more efficiently, organisations rely on intelligent workflows that integrate analytics, artificial intelligence, machine learning, and automation.
Automated Process Management
Automation of business processes, also known as business process automation, is a technology-enabled method of improving a business’s efficiency, efficiency, or productivity.
Real-time Alerts
These alerts are scheduled to look for events in real-time, triggering alert actions when results meet user-defined parameters within a rolling time window or as results are generated.
Task Management
A task’s lifecycle is managed with the help of task management, which involves planning, testing, tracking, and reporting. Managing tasks can help individuals achieve their goals or groups of individuals collaborate and share knowledge to accomplish collective goals.
Insights
Data Visualisation
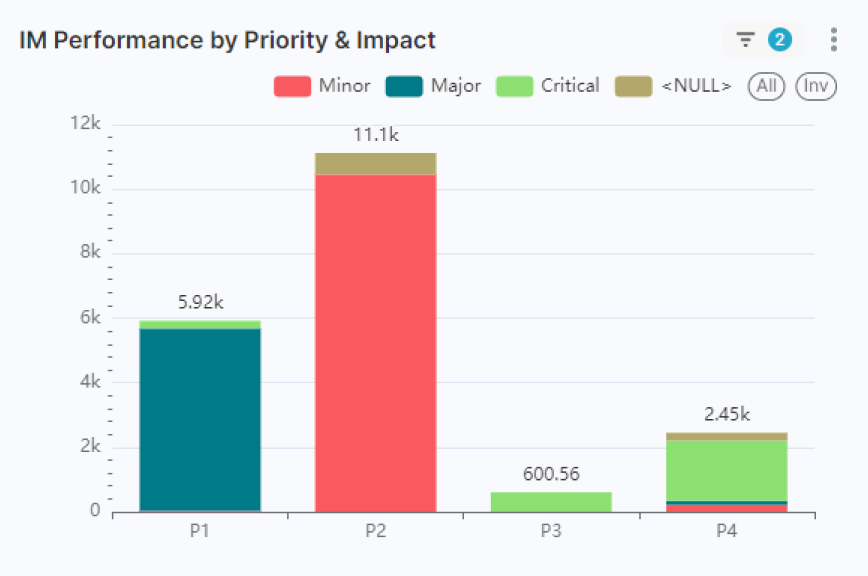
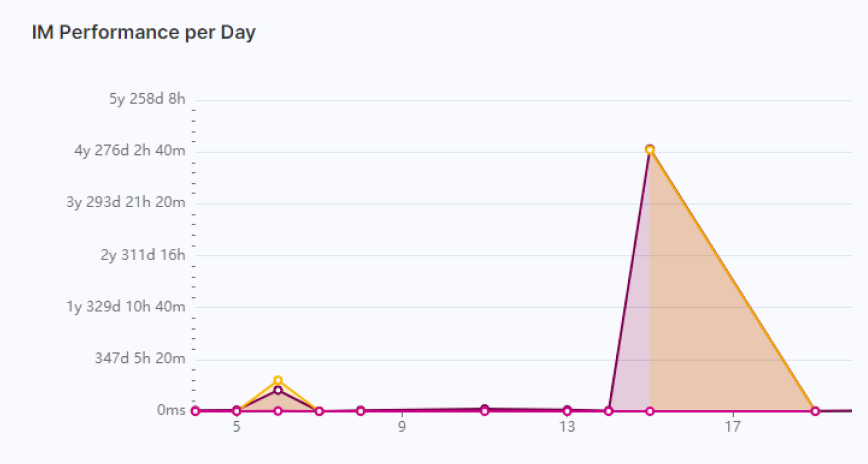
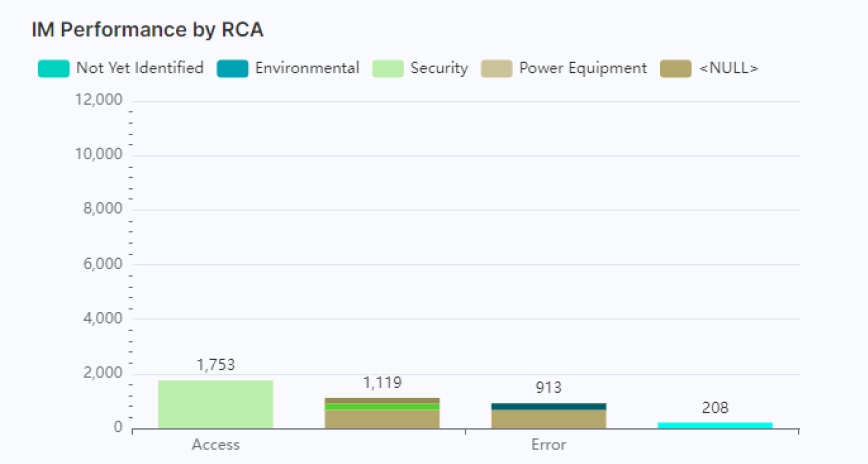
By using static, dynamic, and interactive visual items to represent large amounts of complex quantitative and qualitative data and information, data and information visualisation is the process of designing and creating easy-to-communicate and easy-to-understand graphics and visual representations.
Graphing
As well as providing an excellent visual representation of complex data, graphs provide an understanding of what is going on in the data by highlighting relationships between variables or sets of data.
Mapping
By connecting the dots of hundreds or thousands of insights you see a bigger picture and context emerge that you might miss if you inspect individual insights.
Digital Twins
Using our individually designed digital twins you can easily check on your organisation to help you monitor, simulate real situations and their outcomes allowing informed decision making to be at the forefront of your company
Dashboards
The Affectli dashboards allow you to quickly and easily see any tasks assigned to you, a team you are in, completed tickets, and run any apps that you require. This lets you see as errors come in and see the status of tickets at a glance.
Analytics
By analysing data, we can see insights and meaningful data that we might otherwise miss. Analytics is the process of discovering, interpreting, and communicating data patterns.


IoT

Hardware & System Agnostic
Despite the type of hardware or network they are connected to, IoT devices and networks can be easily integrated with the system. Automated Rules and Scheduling: Set up rules and schedules to control IoT devices automatically, so they need not be manually controlled.
Contact us to start revolutionizing your business