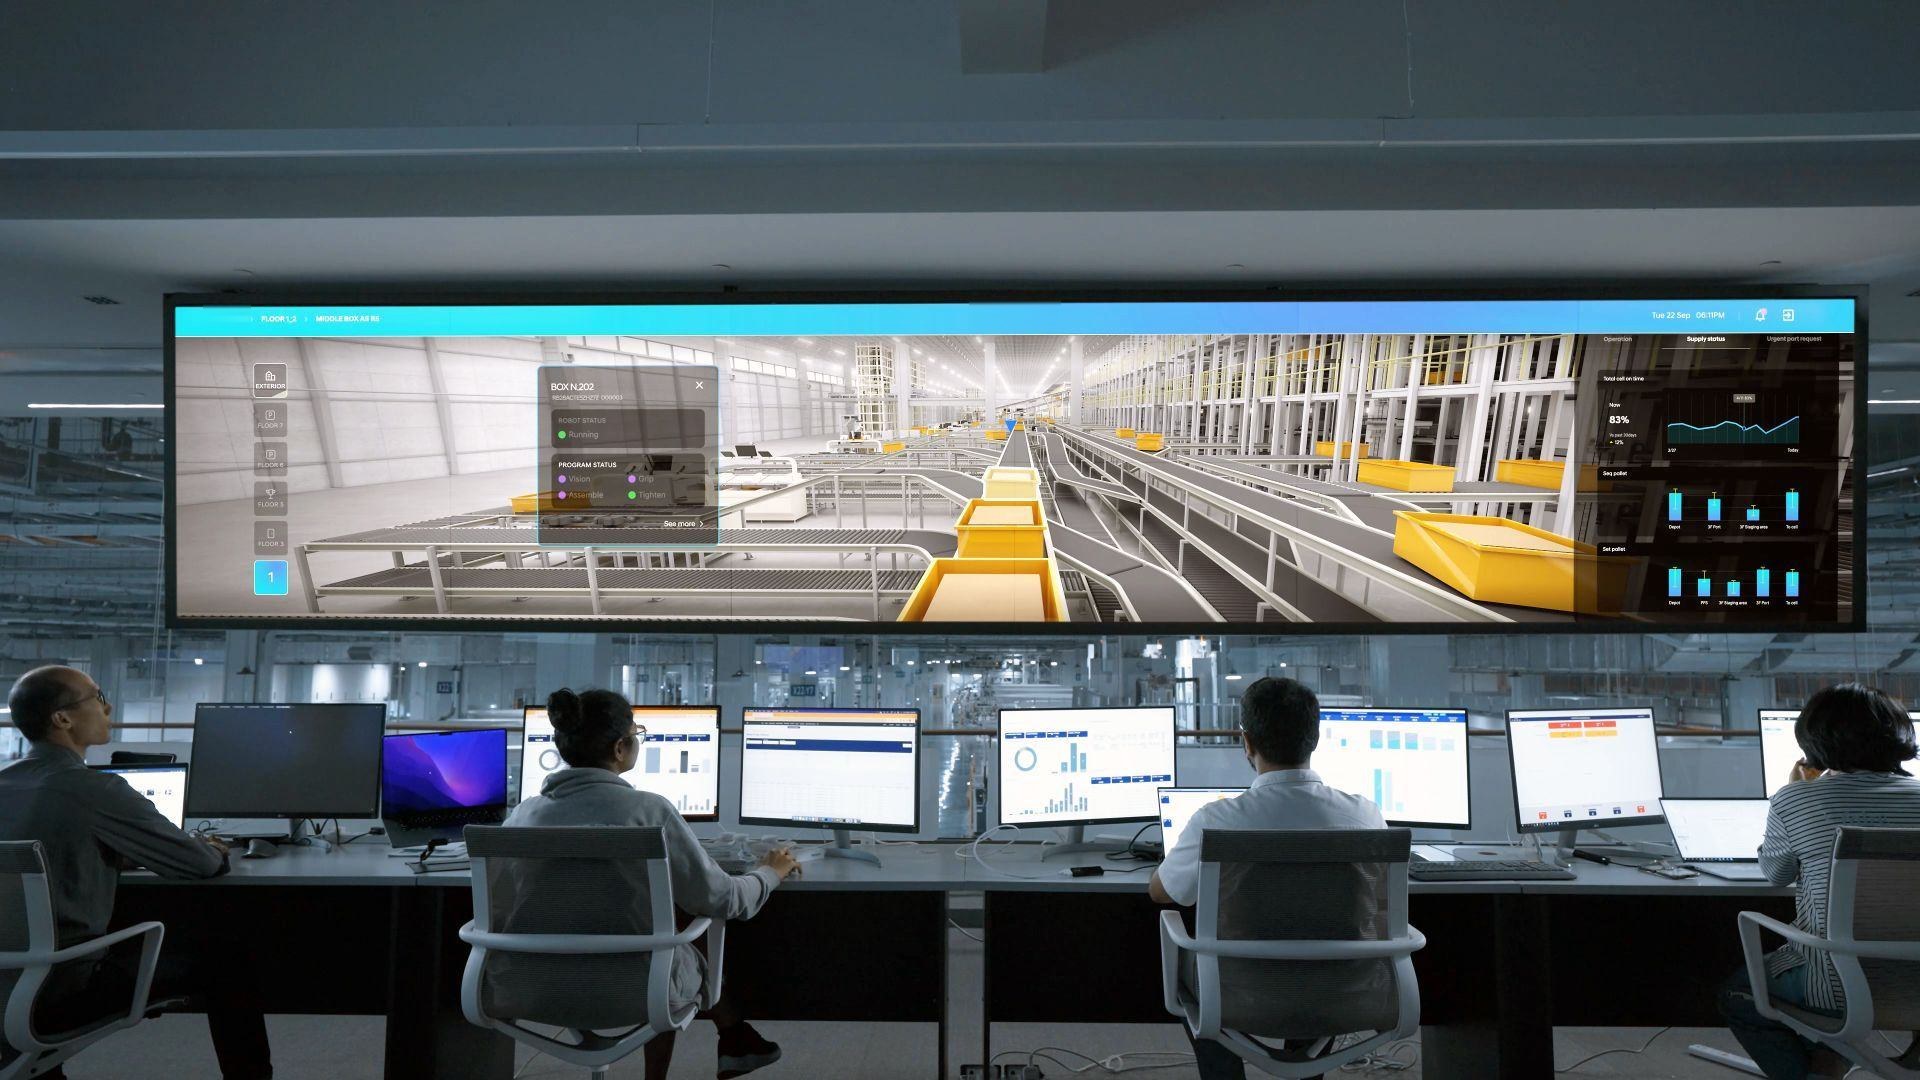
Use cases
What each team gets, from asset monitoring to field operations.
Choose a use case to see who it serves, what Affectli does and what changes for that team. Each one is a view on the same ontology.
Asset management and monitoring
Affectli tracks the live condition of every asset, device and system you connect. Predictive models from the AI engine of your choice run on live and historical data, and flag the assets drifting towards failure.
OutcomeMaintenance is planned from the asset’s condition, and the work order is raised as soon as a rule or a model fires.
- Typical objects in the ontology
- AssetSensorMeasurementWork Order
- Typical systems connected
- SCADA / PLC · IoT sensors · Historian · EAM / CMMS
| Asset | Health | Vibration | Status |
|---|---|---|---|
| AST-55812 · Pump P-2 | 62 | 7.1 mm/s ▲ | Wear |
| AST-55807 · Pump P-1 | 91 | 2.3 mm/s | OK |
| AST-56120 · Pump P-3 | 84 | 3.0 mm/s | OK |
| AST-56204 · Blower B-1 | 71 | 5.6 mm/s ▲ | Service |
| AST-56311 · Actuator V-12 | 95 | n/a | OK |
| AST-56418 · Pump P-1 | 88 | 2.7 mm/s | OK |
Digital twins of live assets
A digital twin in Affectli is a schematic view of one asset, a site or a whole network, kept live by the Mi-Stream engine. Operators drill from the site to a single value, such as a generator’s fuel level or a server room’s temperature.
OutcomeRemote sites are checked from the control room before anyone travels, and maintenance is planned from the same view.
- Typical objects in the ontology
- SiteAssetSensorDocument
- Typical systems connected
- Generator and fuel telemetry · Power and battery monitoring · Environmental sensors · CCTV
Situational awareness and incident management
Situational Awareness puts every site, asset, person and vehicle on one map, and icons change colour on fault or alarm. Each record in the Events Monitor opens to its full history: people, documents, status, actions and severity.
OutcomeThe nearest qualified person is found and dispatched from the same screen, and every step of the incident is recorded.
- Typical objects in the ontology
- IncidentZoneCameraPatrolVehicle
- Typical systems connected
- CCTV / VMS · Access control · Vehicle tracking · Field reports from phones and tablets
Field operations and workforce management
Each crew gets its tasks, messages and documents in one A-Box workspace, with end-to-end encrypted messaging and broadcasts. Supervisors see who is where, on which job and with which skills, including contractors and vendors working under their own permissions.
OutcomeThe right person goes to each job, and every check-in, permit and handover is recorded against it.
- Typical objects in the ontology
- PersonCrewSkillPermitWork Order
- Typical systems connected
- Rostering · Access control · Mobile check-in · Vehicle tracking
| Person | Skills | Status | Task |
|---|---|---|---|
| PER-1102 CRW-14 | Electrical · HV | On site | WO-20931 |
| PER-1187 CRW-14 | Mechanical | Travelling | WO-20934 |
| PER-2240 V-07 | Civil | Permit | PTW-0472 |
| PER-1311 CRW-22 | Instrumentation | On site | WO-20940 |
| PER-3302 Control | Shift lead | On shift | 3 approvals |
Production scheduling in manufacturing
Affectli sets live machine states against the planned schedule, so changeovers and stoppages show as they happen. Analytics from the production machinery show where floor layout or sequencing costs time.
OutcomePlanners adjust the schedule against what the lines are actually doing.
- Typical objects in the ontology
- LineMachineProduction OrderDowntime Event
- Typical systems connected
- MES · PLC and machine data · ERP · Quality records
Output productivity
The Mi-Stream engine combines operating times, delays, geological or process conditions, and equipment and consumable purchases. Affectli then sets output against the labour and equipment behind it, live.
OutcomeManagers see why output moved, delay by delay, and act on the cause.
- Typical objects in the ontology
- ShiftMachineDelayConsumableOutput Record
- Typical systems connected
- Fleet and equipment telemetry · Weighbridges · Shift logs · Procurement
Insights: dashboards and reports
Customisable dashboards, maps, trend graphs and sunburst reports draw on the same live and historical data. Management dashboards track assigned tasks, ticket status and errors, and the drag-and-drop report builder turns them into the monthly or annual report.
OutcomeLeaders review the operation from the same record the control room works from.
- Typical objects in the ontology
- TicketTaskSiteReport
- Typical systems connected
- Every connected source · Historical data · Spreadsheets
Grid monitoring and energy management
Affectli analyses consumption and load against baseline to spot abnormal patterns early. Each anomaly is linked to its power line, its substation and the crew that can act on it, with outage risk shown on the network map next to the weather.
OutcomeControl rooms manage flow and service quality from one view, and raise the inspection from the same screen.
- Typical objects in the ontology
- FeederSubstationMeterFaultCrew
- Typical systems connected
- SCADA / RTU · Smart meters · GIS · Weather feeds
| Feeder | Load | vs baseline | Trend · 24 h |
|---|---|---|---|
| FDR-22 | 9.8 MW | +18% | |
| FDR-17 | 6.1 MW | +2% | |
| FDR-31 | 4.4 MW | −1% | |
| FDR-09 | 7.3 MW | +4% |
Every use case runs on the systems you already have.
Each use case draws on the same data fabric: one connected layer across the systems you already run. The Mi-Stream engine ingests their feeds, applies your rules and integrity checks, and keeps the ontology current while control rooms keep working.
- Your systems stay where they are. Nothing is replaced.
- Affectli connects to each of them, where they run.
- The Mi-Stream engine checks every reading on its way in.
- Every use case runs on the same live model.
A live model of your whole operation.
Assets, sites, people, events and work are held as connected objects with live properties, in the terms your teams already use. Data pivots from any point with a single click.
See the ontology →Connects to everything you run. Replaces nothing.
Affectli connects to SCADA, PLCs, IoT sensors, GIS, CCTV, access control, business systems and legacy databases, and leaves them in place. It is system and device agnostic.
See how it connects →Your data stays yours, wherever Affectli runs.
You own your data by contract. Affectli is licensed as SaaS, PaaS or on-premises, and access is set by classification and role, down to the column.
See data sovereignty →Keep exploring
See your first use case running in Affectli.
Tell us the operation and the systems involved. A product specialist will show the ontology, the Events Monitor and the workflows for that use case, on your own scenario.